Monitoring, inspection, alerts, tickets, prediction and analytics form one closed loop rather than a feature list.
Site-wide real-time monitoring
Threshold settings and automatic anomaly flagging
Device status and performance parameters collected by the second.
Automated inspection
Inspection results recorded automatically
Scheduled plans run automatically, with configurable inspection items and pass criteria.
Closed-loop alerts and tickets
Tiered SMS / app alert push, repair dispatch, handling tracking, and rated service records.
AI fault prediction
From reactive repair to proactive prevention
Health assessment and fault prediction based on big data.
Digital twin visualisation
Historical trend queries
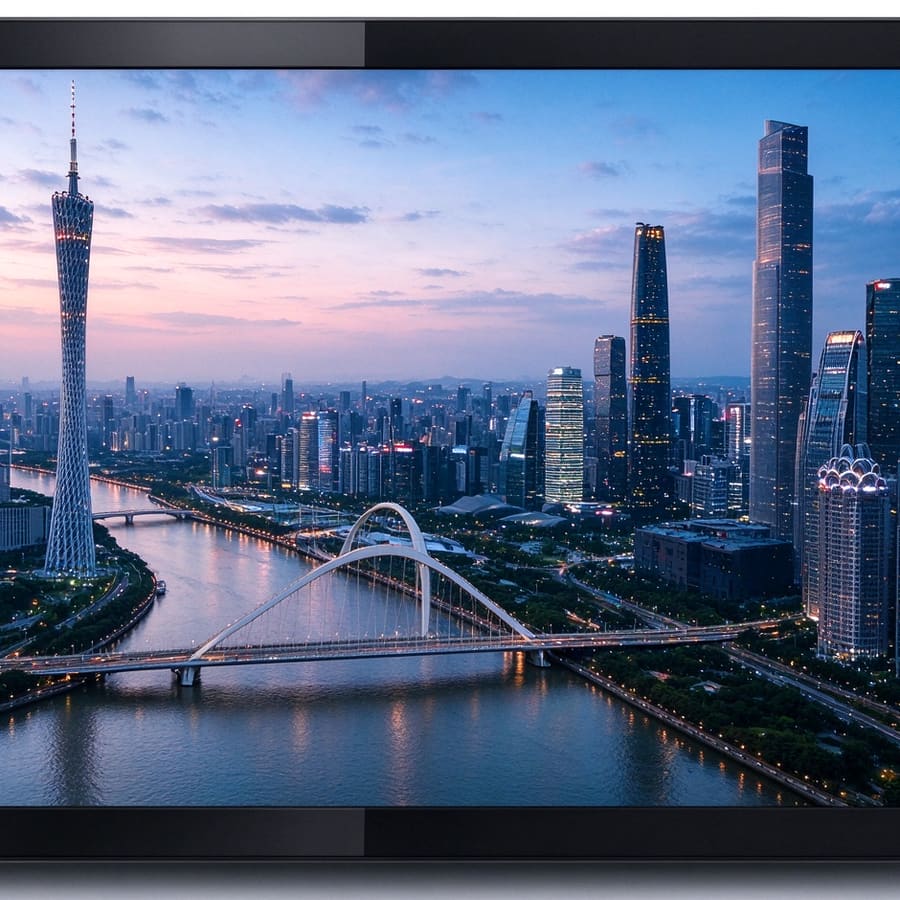
A visualisation screen gives one-screen overview of device health.
Data-driven decisions
Trend forecasting with automatically generated, exportable reports
KPI statistics for failure rate, availability and repair time.
MonitoringMore timely
InspectionSmarter
RepairsMore closed-loop
PredictionMore accurate
PresentationMore intuitive
DecisionsMore informed
02 DEPLOYMENT & HARDWARE
Software needs a complete hardware foundation
Servers, cloud hosting, collection access, and management consoles and screens — the platform only runs when all four are in place.
Operations platform server
Required
Hosts platform applications and operations data, deployed on the customer side.
Cloud server hosting
Optional
A cloud server sized to your monitoring points, billed annually, with no upfront hardware investment.
Monitored devices and collection access
Per point
Meeting, AV, projection and power/environment devices connect by point, with protocol integration and status reporting.
Management consoles and screens
As needed
No installation needed on PC or mobile browsers; visualisation screens are configured as presentation needs require.
01 ServerSets data ownership
02 Cloud hostingSets time to go-live
03 Collection endpointsSets management scope
04 Screen terminalsSets presentation quality
03 SYSTEM TOPOLOGY
How the system connects
Monitored devices report status through collection access; the platform judges, raises alerts and dispatches work, while consoles and screens present a unified view.
Operations data centerDATA CENTER · Deployed on the customer intranet
Smart Operations Platform
Monitored devicesMeeting · AV · projection and displays · power and environment
Collection accessProtocol integration · Status reporting
Alerts and ticketsTiered dispatch · Closed-loop ticketing
Management consoles and screensPC / mobile / visualisation screens
Collection
Monitoring
Alerts
Dispatch
Archiving
Monitoring and collection
COLLECTION
Each connected device or system counts as one monitoring point
Standard protocol integration with second-level status and performance reporting
Thresholds configurable, anomalies flagged and graded automatically
Inspection items and pass criteria are configurable
Data flow
DATA FLOW
Device status → collection access → platform judgement and storage → alert dispatch → inspection and support report archiving
The whole process stays on the customer's intranet; data never leaves the site
Deployment model
DEPLOYMENT
The server is deployed on-premise, keeping the asset register and operations data under your control
Or choose a cloud server by scale with annual billing
The management console needs no installation and supports tiered permissions
Standard configuration: one operations platform server plus collection access sized to your monitoring points; the management console runs in existing PC and mobile browsers with no client to install.
04 APPLICATION SCENARIOS
Six application scenarios
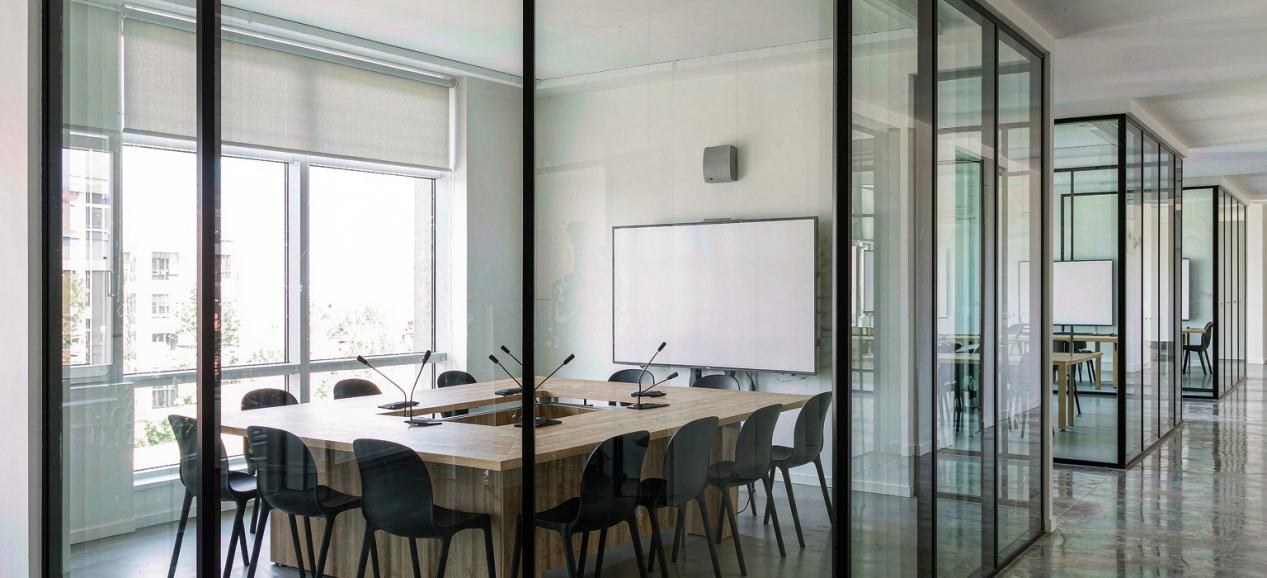
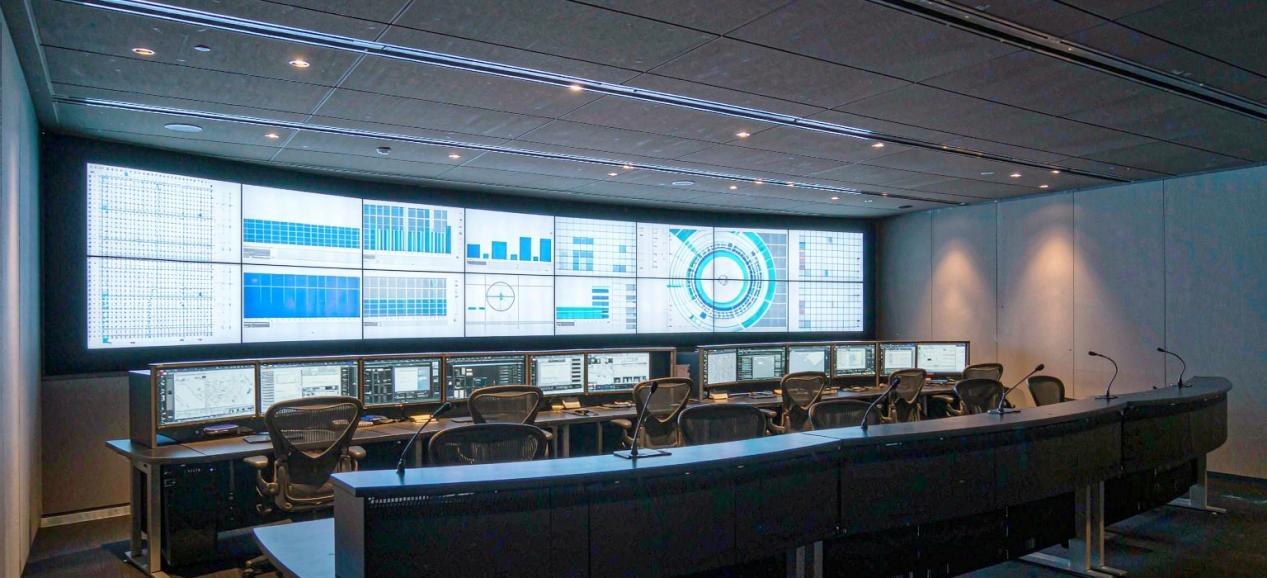
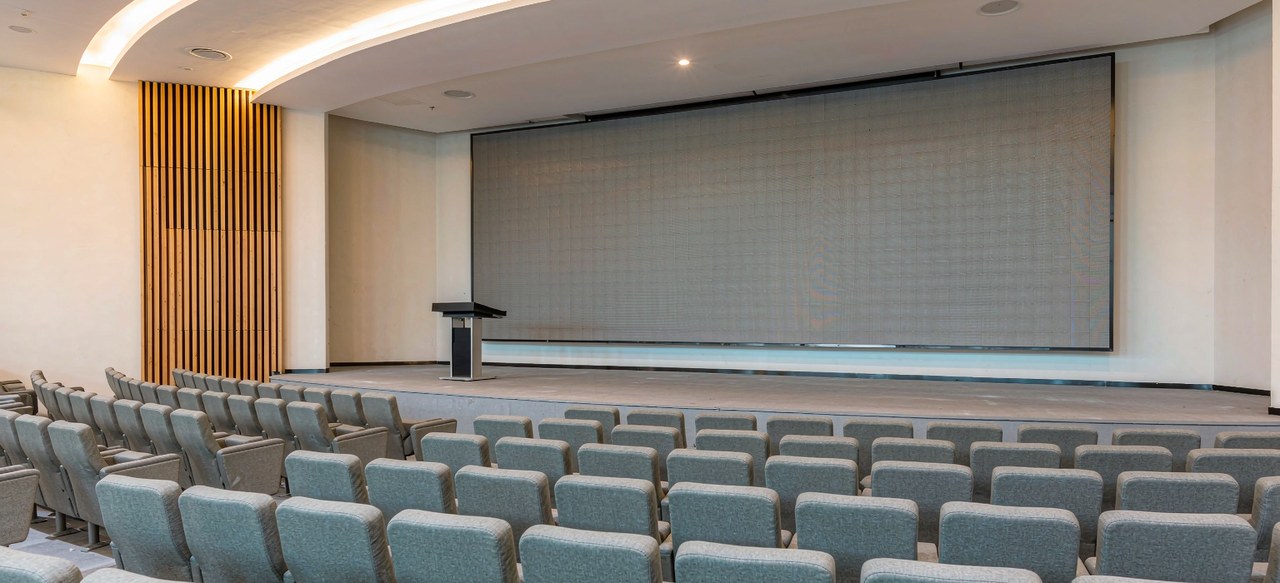
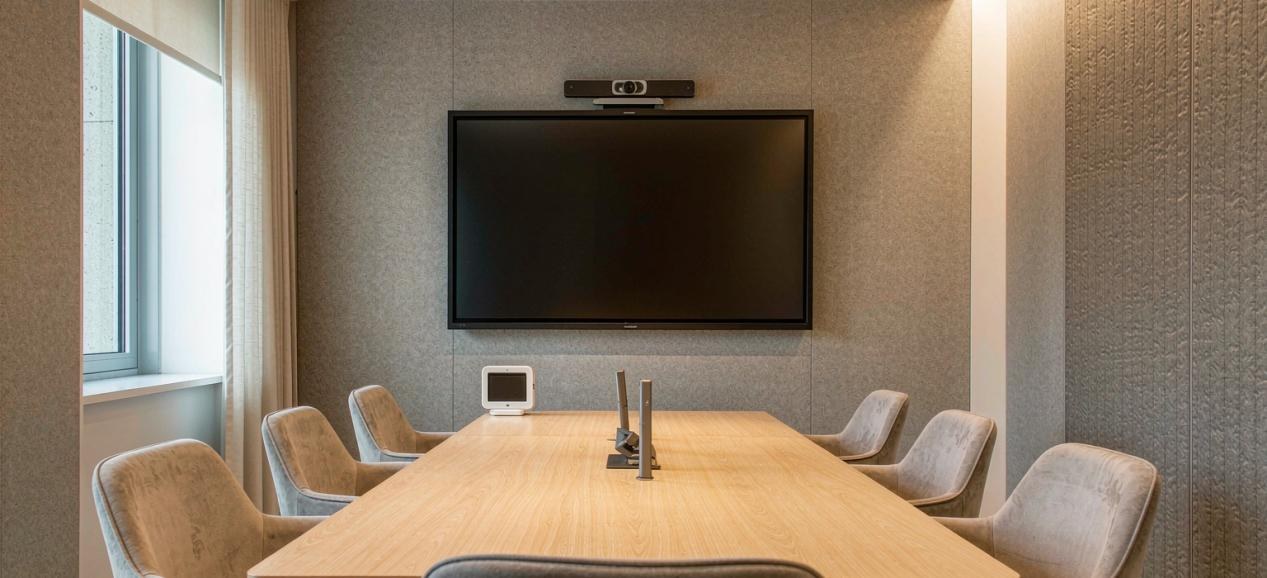
From government offices and command centres to auditoriums and ballrooms, six typical scenarios share the same monitoring and closed-loop capability.
Key government meeting support
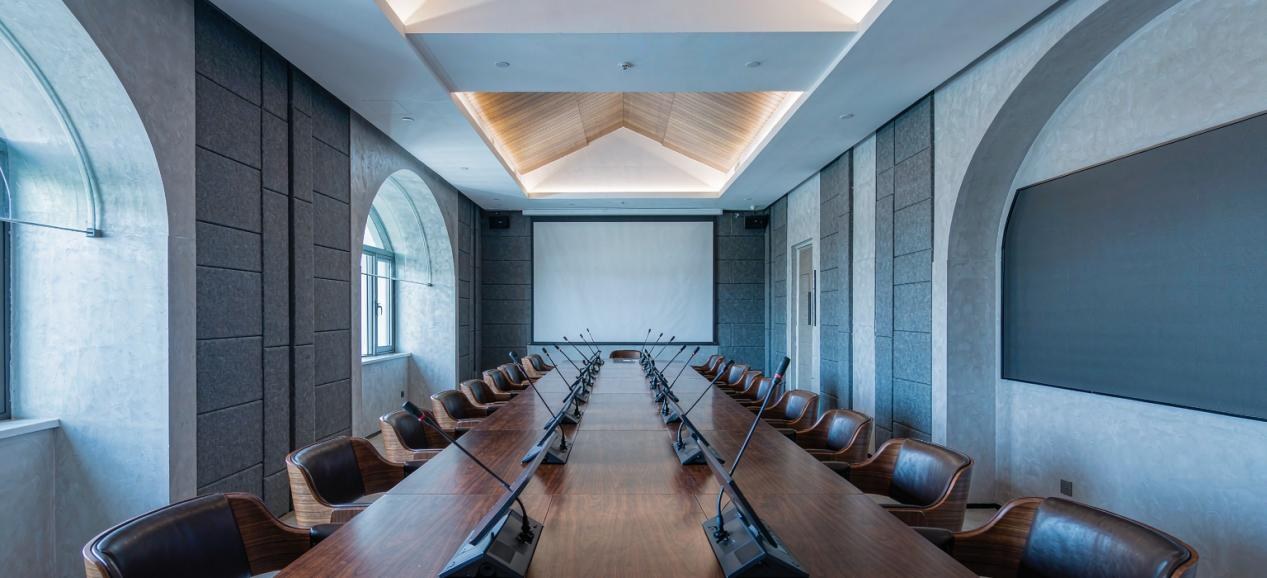
Automated pre-meeting inspection clears hidden risks for zero-error key meetings. Device status across the site is visible on one screen throughout.
Hotel ballrooms / exhibition centres
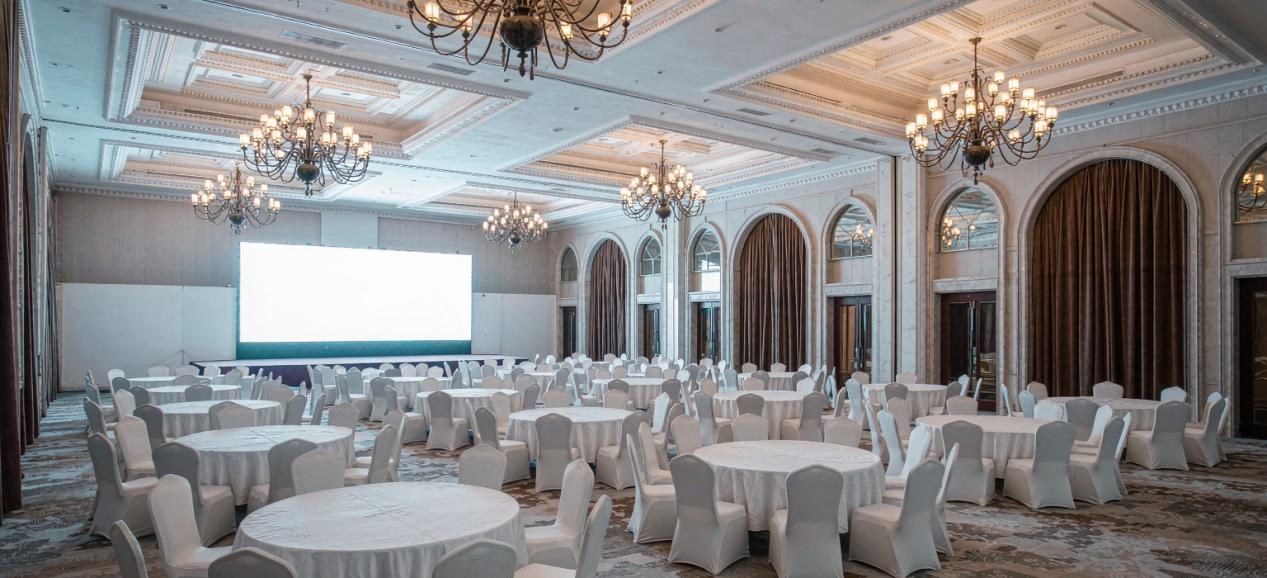
Automated pre-event inspection clears faults in advance and high-use device availability is visible on one screen. Ad-hoc AV and projection devices are managed as soon as they connect.
Corporate HQ meeting room clusters
AV and projection devices monitored online so faults are found early. Meetings stay uninterrupted, anomalies are dispatched automatically and handling is recorded.
Command centres / dispatch halls
24/7 power and environment monitoring with tiered alert closure. Second-level reporting of tens of thousands of data points, all visible on one screen at the command desk.
Auditoriums / multipurpose halls
Post-meeting review and archiving, with automated inspection records replacing manual forms. Every meeting generates a support report that can be exported.
Multi-venue chains / branch sites
All venue devices managed in one place with HQ-wide overview. Remote sites stay visible and manageable, and new venues connect without changing the architecture.
Scenario-agnostic: the chain is the same — collection → monitoring → alerts → tickets → archiving — one closed loop covers every scenario.
05 FAQ
Six questions that come up at selection
Monitoring points, connection methods, servers and screens — settle these first.
Q1
How are monitoring points counted, and how far can the system scale?
Each device or system connected through collection counts as one monitoring point. Packages scale at 100 → 500 → 1000+, expanding with venue size without replacing the platform.
Q2
Can older devices of other brands be connected?
Standard protocols are supported; legacy devices without open interfaces can connect through a collection gateway or be managed from the device ledger, joining the system first and being replaced gradually.
Q3
What server specification is needed?
Entry: 4 cores / 8 threads, 16 GB RAM, 500 GB disk. Higher specification: 8 cores / 16 threads, 32 GB RAM, 1 TB disk. Both are deployed on the customer side.
Q4
Can we start on the cloud without our own server?
Yes. Choose a cloud server sized to your monitoring points and pay annually — no upfront hardware investment, fast go-live and no maintenance burden.
Q5
Do we have to add a visualisation screen?
No. The management console runs in a PC browser, phone or tablet with no client to install; a visualisation screen only improves presentation and is configured for reporting needs.
Q6
Who owns the device register and operations data?
The server runs on the customer side, so the asset register, inspection records, alerts and ticket data are created and archived on your intranet — data never leaves the site.